On the tracings, the Bolton triangle is made according to Broadbent’s technique, consisting of points nasion, sella and the Bolton point, which is the upper point on the concavity at the back of the occipital condyles. The Bolton triangle was identified to be an area on the cranial base connected to the face. It was designated as the most stable area for reference of serial growth comparison. Broadbent set a point inside the triangle called the registration point, which is the midpoint of a perpendicular line from the Bolton plane to the sella. Serial tracings are pinned on this same point with their Boltons parallel. The head was divided into two: the cranium and the face. The face was divided into three: the upper face, teeth and alveolar area, and the mandible. The other landmarks used by the analysis were the orbitale, machine porion, pogonion, point A (subspinale), point B (supramentale) and gnathion. The planes used were the Bolton plane, Frankfort horizontal, mandibular plane, facial plane, denture base limit, occlusal plane and Y axis. The angular relationships of these planes were noted as the facial angle, angle of convexity, anteroposterior relationship of the denture bases and mandibular plane angle.
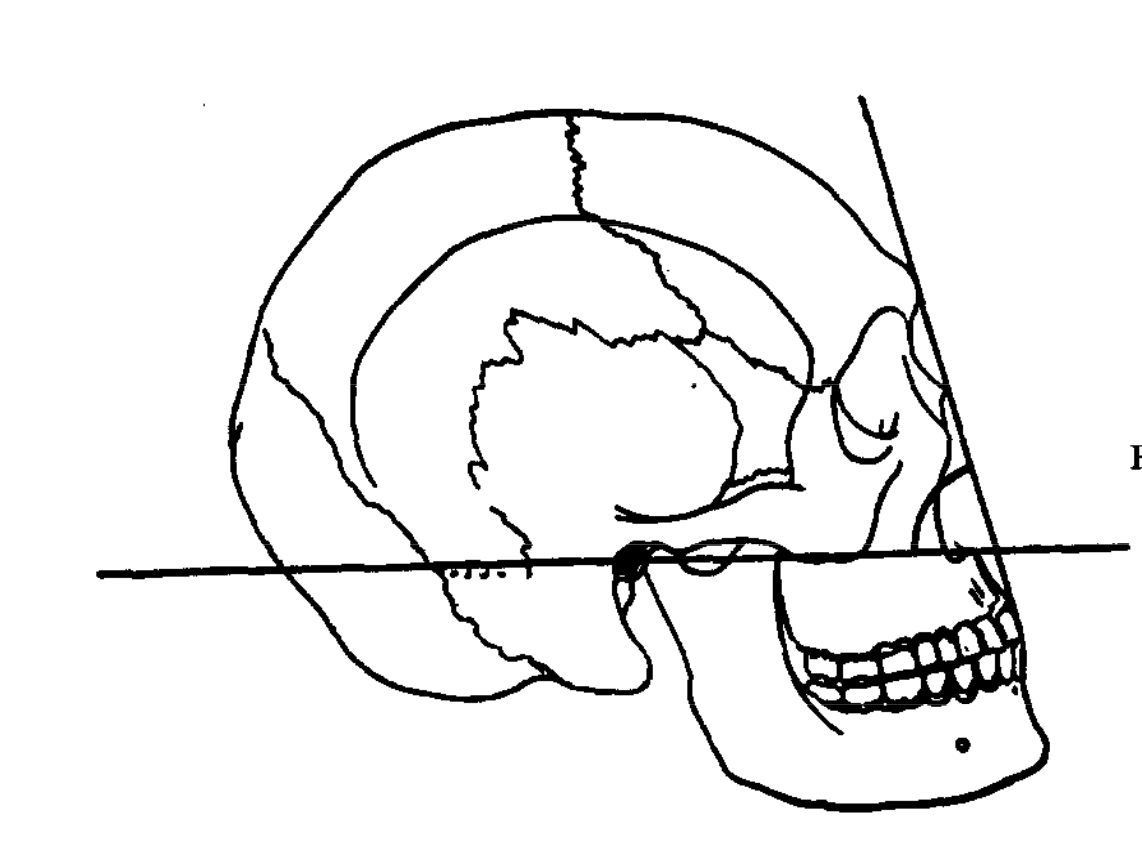
Both the maxilla and mandible determine the individual’s skeletal pattern. The teeth and alveolar process are separately evaluated as the “denture.” The facial type is classified according to the relative position of the mandible. Usually, the skeletal form shows to be consistent with the facial type of the patient. The facial angle, formed by the facial plane (Na-Pog) to the Frankfort horizontal, shows the degree of recession or protrusion of the chin. The recessive chin represents a Class II skeletal malocclusion, while the protrusive chin represents a Class III malocclusion. The angle of convexity, on the other hand, measures the degree of protrusion of the maxilla. It is formed by two lines, each running from nasion and pogonion meeting at point A. If point A is located posterior to the facial plane, a minus degree (concave) measurement is obtained, if anterior, a plus degree (convex) is noted. The A-B plane shows the relation of the anterior limits of maxilla and mandible to each other and to the facial profile. It provides a good outlook of the degree of difficulty in correcting the axial inclination and incisal relation of the anterior teeth. The mandibular plane angle shows the relationship of the Frankfort plane to the lower border of the mandible. Note that as the chin is positioned more posteriorly (decreased facial angle), the mandibular border gets steeper (increased mandibular plane angle). The Y axis, which is a line from Sella to Gnathion, was used to determine the direction of growth from under the cranium.
The second part of the analysis deals with the study of the relation between dental and skeletal patterns. The factors considered are the cant of occlusal plane, axial inclination of upper and lower incisors to each other, axial inclination of the lower incisors to the mandibular plane, the axial inclination of lower incisors to the occlusal plane, and the amount of protrusion of the maxillary incisors. Skeletal Class II cases show a relatively steep occlusal plane while skeletal Class III shows a more horizontal occlusal plane.
The Downs analysis aimed to present a normal range of facial and dental patterns. The range of values obtained by this analysis may be used as a basis to obtain a balanced relation of the dental and skeletal patterns of the patient during treatment. Going far beyond the normal ranges implies a higher degree of difficulty in getting a harmoniously balanced result of treatment. The way how the biological form, function and esthetics relate to each other as a whole is far most important in achieving a favorable orthodontic treatment outcome.
